I’ve been emphasizing the value of competitive districts in potentially making Congress less polarized and more effective. In earlier posts, I’ve explained how Dave’s Redistricting App (DRA) can be used to judge maps along a number of dimensions. I now want to build off those earlier posts to illustrate how we can compare the preliminary map the independent redistricting commission has released with a map that would maximize the competitiveness of districts.
This is particularly worth doing in CO, because the legal criteria require the Commission to give substantial weight to competitiveness. As a reminder, after specifying that districts must comply with constitutional requirements for population equality and the VRA, the amendment states:
(2) (a) as much as is reasonably possible, the commission’s plan must preserve whole communities of interest and whole political subdivisions, such as counties, cities, and towns.
(b) districts must be as compact as is reasonably possible.
(3) (a) thereafter, the commission shall, to the extent possible, maximize the number of politically competitive districts [emphasis added]
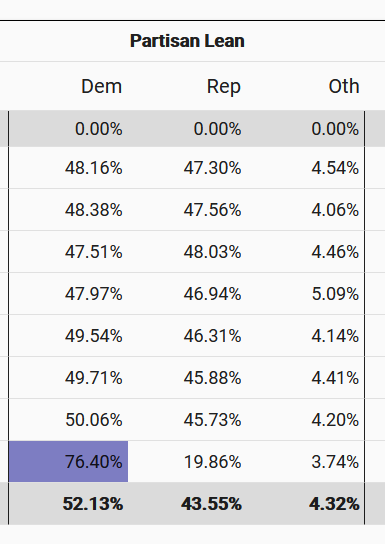
In DRA, a user has shown how a map could be drawn that would make 7 of out CO’s 8 congressional districts highly competitive. Since CO leans Democratic, the map concentrates likely Democratic voters into one district, which then enables several of the remaining districts to be highly competitive and 7 districts to be competitive (traditionally a 5 point spread defined a competitive district, though with today’s polarization, a 3 point spread might be more appropriate) . Based on a composite of relevant, past election results, here’s how those districts would be predicted to perform (incumbents, of course, would hate this map):
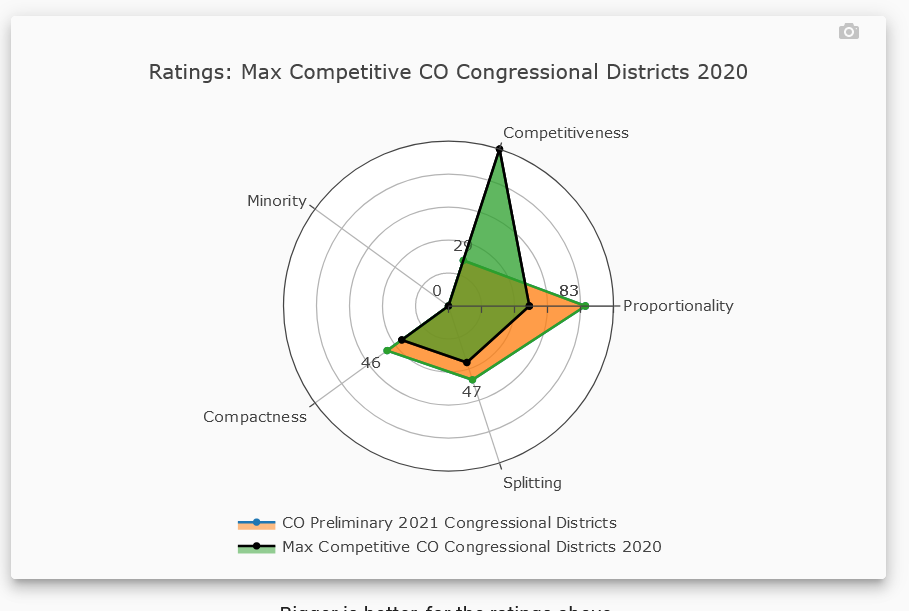
But how does this map come out along other dimensions, particularly in comparison to the official, preliminary map. Turns out it does quite well on two key dimensions: the districts are not significantly less compact than in the official plan and do not split counties up significantly more than in the official plan.
The one area in which this highly competitive map fares worse is in terms of how fair the likely partisan outcomes are under each map. The number of Democratic seats closest to proportional representation in CO is four, given the overall statewide political preferences. This most competitive map leans more than that toward the Democrats; statistically, the likely number of Democratic seats under it is 5.18. But given how competitive these districts are, the Republicans would have a reasonable shot at winning 6 or maybe even 7 of the districts.
Here is the more formal visualization of how this competitive map compares on these various dimensions to the official, preliminary map. Note that the great “radar” diagram is the competitive map and the orange one is the official, preliminary map.
One final point: it’s not clear either way whether this highly competitive map would be a legal map. Recall that the criteria require reasonable efforts to preserve “communities of interest” before maximizing competitiveness. The “community of interest” criterion in general is vague, and DRA does not, for that reason, enable assessments of how maps do on this criterion.
So I view this highly competitive map as putting a marker down — how much closer could a map come to creating more competitive districts while still complying with the relevant legal criteria and good public policy. Perhaps the commission will address questions of that sort.