Historically, the general public has had no access to accurate partisan information about district plans. The operatives who painstakingly design the plans have had such information, of course. But members of the opposing party, journalists, activists, and ordinary citizens have either had no partisan data at all, or, at best, estimates based on disaggregating and reaggregating presidential votes. These estimates are useful, but presidential votes aren’t identical to legislative votes and don’t incorporate a factor, incumbency, that inevitably affects legislative votes.
To remedy this situation, PlanScore has just launched its Score a Plan feature. Users can now upload a district map at any level (congressional, state senate, or state house) for any of twelve states (Florida, Georgia, Illinois, Maryland, Massachusetts, Michigan, North Carolina, Pennsylvania, Tennessee, Texas, Virginia, or Wisconsin). Users can also specify whether each district has a Democratic incumbent, a Republican incumbent, or no incumbent. The site then instantly returns a detailed analysis of the map’s partisan characteristics. This analysis includes substantial information about each district as well as plan-wide scores like the efficiency gap, partisan bias, and the mean-median difference.
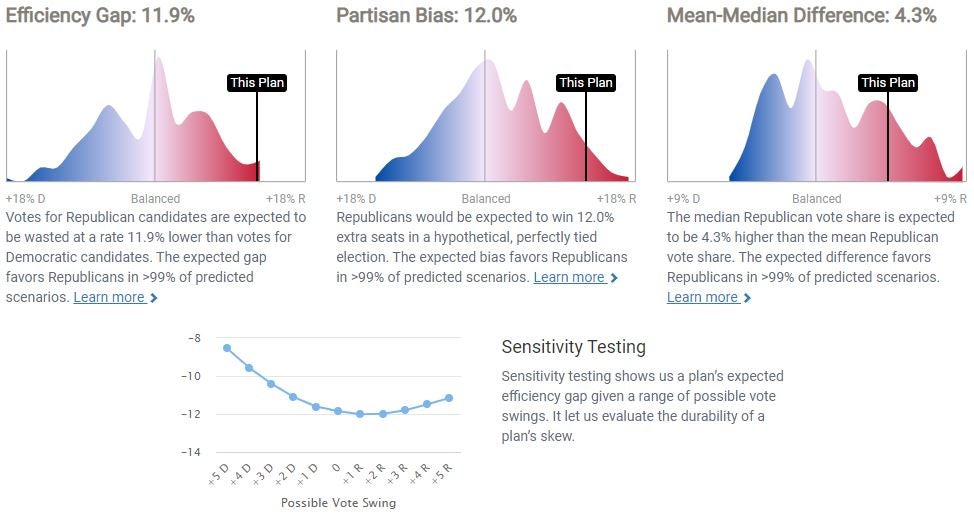
As a (nonrandom) example, here is PlanScore’s analysis of the current Wisconsin state house plan, assuming all open seats. The plan has a 12% pro-Republican efficiency gap, a 12% pro-Republican partisan bias, and a 4% pro-Republican mean-median difference. All these scores are very large by historical standards (as the below histograms indicate). The plan would also remain highly skewed in a Republican direction under a wide range of electoral conditions (as shown by the below sensitivity testing).
PlanScore’s analyses are based on a model incorporating election results for all congressional delegations and state legislatures from 2012 to 2018. Interested readers can find a discussion of the model here, as well as validation of the model’s predictions through a series of rigorous tests. The model’s scores for an uploaded map assume an average election in the 2012-2018 period, while the sensitivity testing considers other electoral environments.
What might be the uses of this information? Here are a few:
- If H.R. 1 becomes law, it would presumptively bar congressional plans with partisan skews above certain thresholds. PlanScore’s analyses could quickly reveal whether draft maps are likely to fall above or below these limits.
- In states whose constitutions have been construed to prohibit partisan gerrymandering (like North Carolina and Pennsylvania), PlanScore’s analyses could indicate the severity and durability of maps’ partisan skews. (Of course, additional information might be needed to establish liability.)
- In states that bar maps drawn with partisan intent (like Florida), PlanScore’s analyses could be included in the legislative record. It would then be easier to infer that legislators voting for a plan shown to be highly skewed intended to benefit their party.
- In all states, instantly available information about maps’ partisan characteristics could be politically helpful. It could mobilize popular opposition to a highly skewed map, or, conversely, build support for a more balanced proposal.
As noted above, PlanScore currently offers instant scoring for twelve states. Additional states will be added in the coming months, with the goal of full national coverage in advance of redistricting later this year.