Yesterday I summarized my forthcoming work with Jowei Chen on the implications of race-blind redistricting for minority representation. Today I’ll talk about our partisan representation findings: how the major parties would be affected if district lines were drawn on a non-racial basis.
To investigate this question, we ran one more round of simulations for each state. As before, we instructed the algorithm to ignore partisanship and to match or beat the enacted plan in terms of equal population, compactness, county splits, and municipality splits. But this time, we also instructed the algorithm to exactly match the existing number of minority opportunity districts in the enacted plan. In combination, these two simulation sets allow us to estimate the partisan effects of race-blind redistricting. The new simulation set ignores party but not race. The original simulation set ignores party and race. The difference between the two simulation sets thus represents the impact of switching from race-conscious to race-blind redistricting, while keeping every other factor constant.
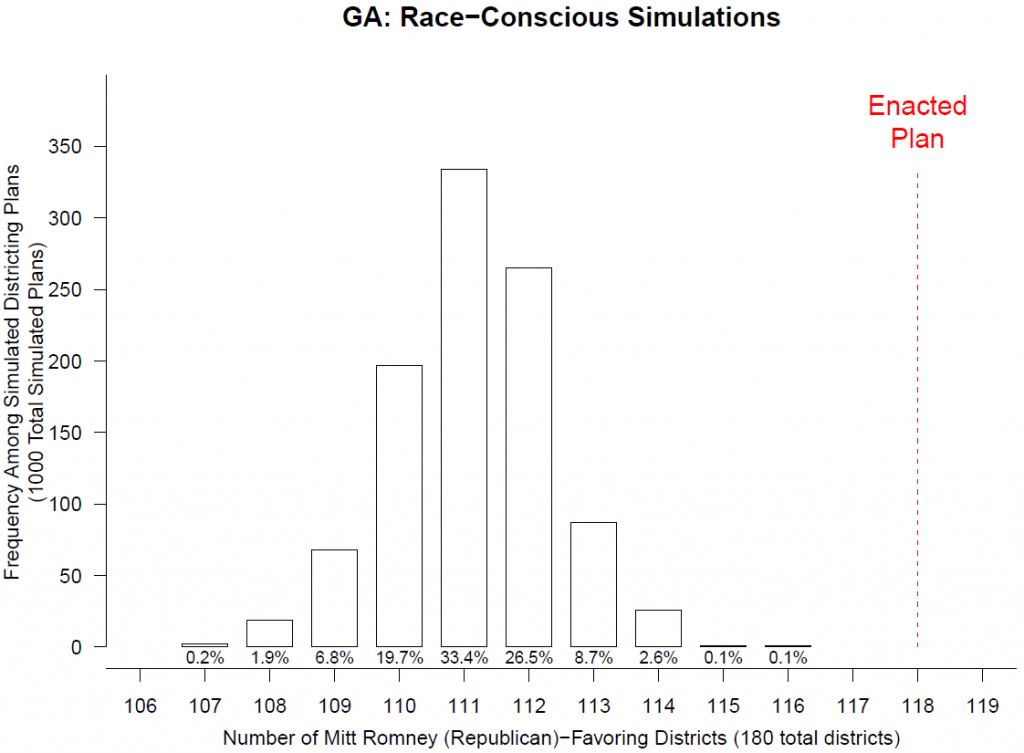
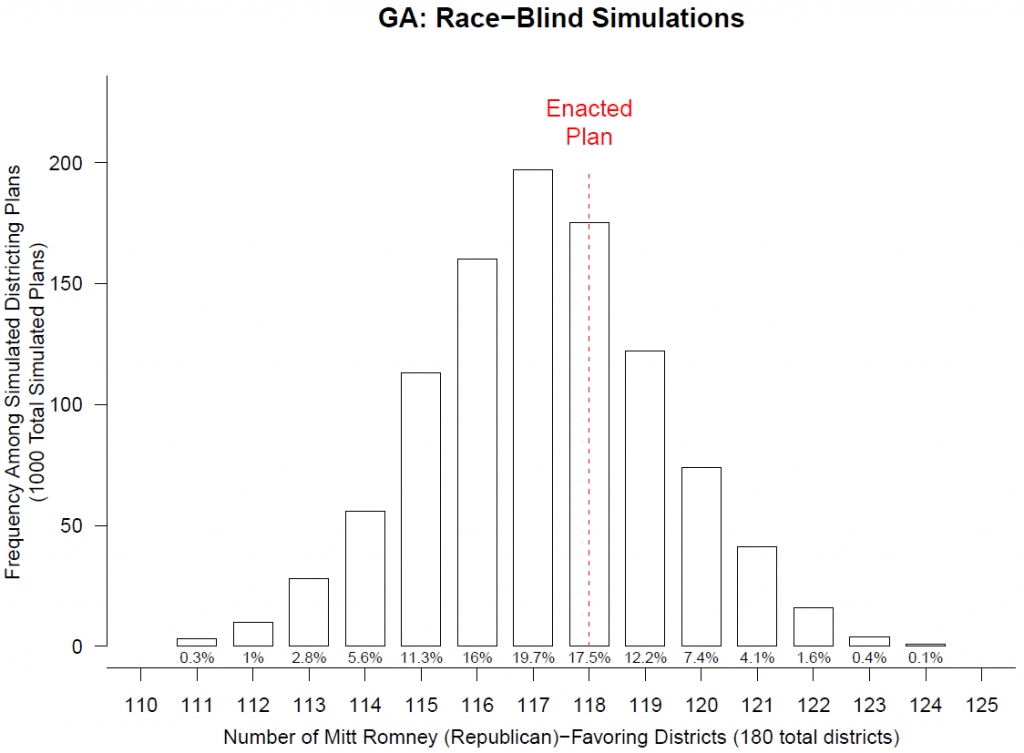
To illustrate, consider another southern state in our dataset: Georgia. There are 118 Republican districts in the enacted state house plan (using 2012 data). In the 1000 race-conscious simulations, which exactly match the enacted plan’s 52 African American opportunity districts, there are anywhere from 107 to 116 Republican districts, with a median and mode of 111 Republican districts. And in the 1000 race-blind simulations, which ignore race altogether, there are anywhere from 111 to 124 Republican districts, with a median and mode of 117 Republican districts. So switching from race-conscious to race-blind redistricting results in about six more Republican districts: a sizable increase.
A few other southern states (Alabama, Louisiana, and Texas) exhibit the same pattern. What’s going on here is that the race-blind simulations contain fewer opportunity districts than the race-conscious simulations. These eliminated opportunity districts, which almost always elect Democrats, are being replaced by non-opportunity districts, which usually elect Republicans thanks to these states’ conservative white populations. But in most states in our dataset, there isn’t a big partisan difference between the race-conscious and the race-blind simulations. Outside the deep South, in particular, Democrats and Republicans do about the same whether the lines are drawn race-consciously or race-blindly.
Our findings challenge the conventional wisdom about the relationship between minority and partisan representation. A common view is that Republicans benefit when more opportunity districts are created because these districts inefficiently overconcentrate minority Democrats. A corollary of this argument is that Democrats should be advantaged by a reduction in the number of opportunity districts. Yet we find no evidence for this proposition. The race-blind simulations do generally reduce the number of opportunity districts compared to the race-conscious simulations (and the status quo). But Democrats don’t do better in the race-blind simulations than in the race-conscious simulations. Instead, they fare about the same in most places—and notably worse in the deep South. At least in that part of the country, the conventional wisdom is the opposite of reality.