I linked yesterday to my forthcoming article with Jowei Chen on the implications of race-blind redistricting. In this post, I thought I’d provide some additional detail about our methods and findings. First, to conduct a non-racial line-drawing process, we used a computer algorithm like the ones featured in several recent gerrymandering cases. For each state we examined (we analyzed nineteen in total), we instructed the algorithm as follows: (1) don’t use racial data; (2) don’t use partisan data; and (3) match or beat the enacted plan in terms of population equality, compactness, county splits, and municipality splits. The algorithm relied on the “recombination” MCMC method and generated 1000 distinct state house maps for each state.
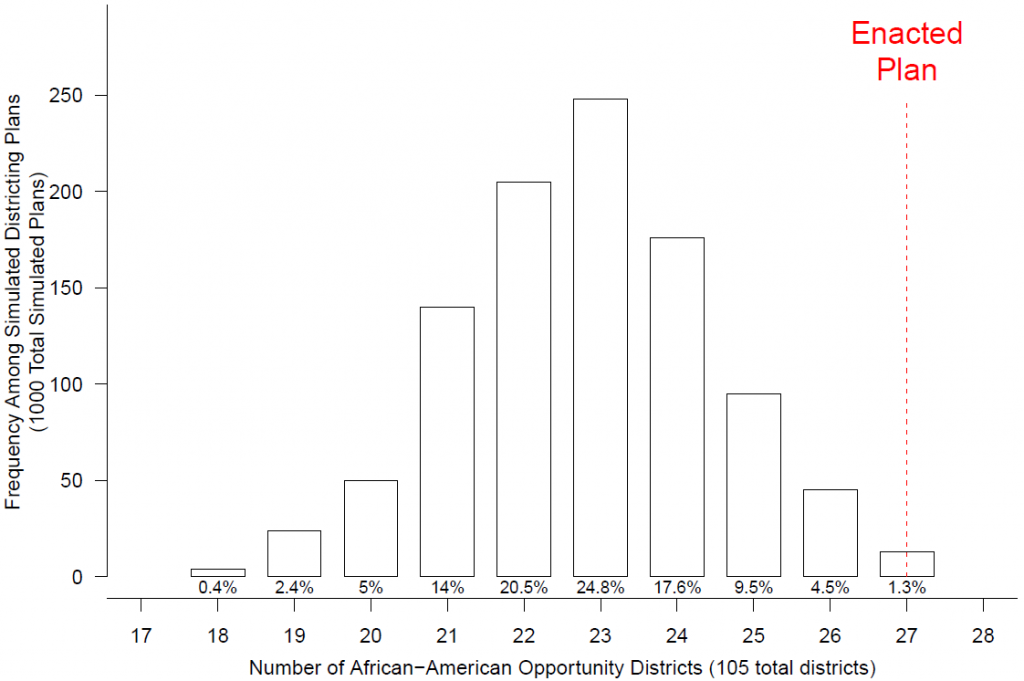
Next, we compared the numbers of minority opportunity districts (districts where minority voters are able to elect their preferred candidates) in the simulated maps to the volume of these districts in each enacted plan. In most (though not all) states we considered, the enacted plan includes more opportunity districts than most of the simulated maps. Take Alabama, for example, alphabetically the first state in our dataset. As displayed below, there are 27 African American opportunity districts in the enacted plan. In the simulated maps, in contrast, black opportunity districts number anywhere from 18 to 27 with a median and mode of 23. The most common outcome of a race-blind redistricting process, in other words, is four fewer black opportunity districts—and four fewer black-preferred candidates elected to the legislature—than now exist.
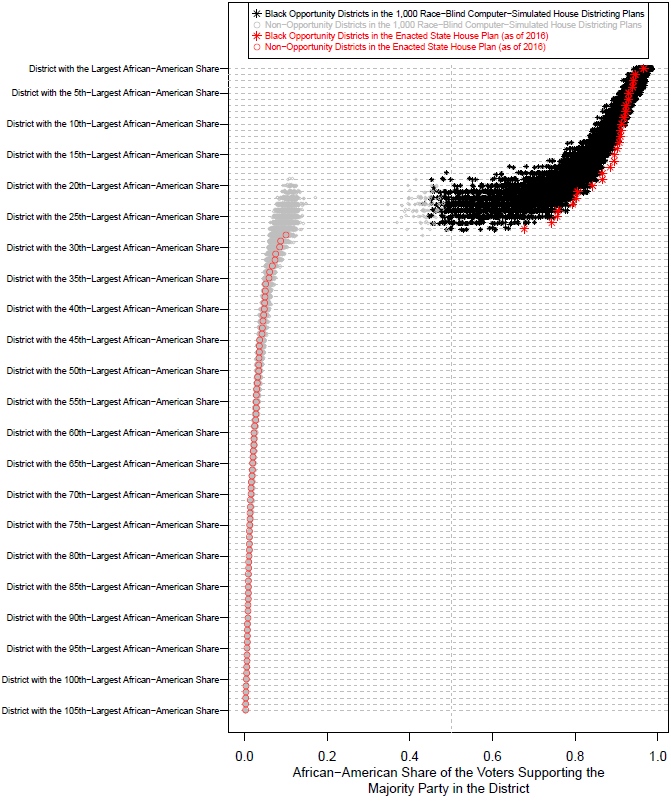
We further investigated the kinds (not just the numbers) of opportunity districts in the enacted plans and simulated maps. In most (though again not all) states in our dataset, the enacted plan’s opportunity districts tend to have larger minority populations than the corresponding opportunity districts in the simulated maps. Consider the below chart of Alabama’s enacted and simulated state house districts, sorted by the proportion of voters supporting the prevailing party who are African American. Almost all the enacted opportunity districts (indicated by red stars) have bigger—often much bigger—shares of black Democrats than the matching simulated opportunity districts (denoted by gray stars). Put another way, the enacted plan’s opportunity districts considerably overconcentrate black Democrats compared to the opportunity districts that emerge from a race-blind redistricting process.
The implication of these results is that minority representation in American government would change significantly if district lines were drawn on a non-racial basis. (Non-racial redistricting has been proposed by Judge Easterbrook in a 2008 case, and may be on the Supreme Court’s agenda, too.) In particular, there would be fewer opportunity districts and so fewer minority candidates of choice elected. The opportunity districts that did arise from a race-blind line-drawing process would also be less heavily packed with minority voters.
Tomorrow I’ll switch gears from minority to partisan representation, and say a few words about how the major parties would be affected by a move from race-conscious to race-blind redistricting.