Yesterday I mentioned a new article on the efficiency gap by Eric McGhee. Today I’d like to highlight a paper that Eric and I recently wrote: The Measure of a Metric, forthcoming in the Stanford Law Review. This paper makes several points, only one of which I’ll emphasize here. This is that there is a high degree of convergence among different measures of partisan gerrymandering, especially in competitive electoral contexts. Accordingly, there is little need to try to identify a single “best” metric; in many electoral settings, any measure will do.
For several decades, most scholars quantified partisan gerrymandering using partisan bias. This metric asks how different the parties’ seat shares would be if they each received the same proportion (typically 50%) of the statewide vote. A few years ago, Eric introduced the efficiency gap, which compares the parties’ respective rates of “wasted” votes (votes that don’t contribute to a candidate’s election). More recently, other academics have advocated subtracting a party’s mean vote share, across all of the districts in a plan, from its median vote share; and comparing the parties’ average margins of victory in the districts won by each of them.
In our paper, Eric and I point out that there are several mathematical links between these measures: Partisan bias and the efficiency gap are equal when an election is tied statewide. The mean-median difference is equal to partisan bias divided by the slope of the seat-vote curve. The efficiency gap is equal to the mean-median difference multiplied by the slope of the seat-vote curve when an election is tied statewide. And the efficiency gap is equal to the difference between the parties’ average margins of victory if these margins are weighted by the shares of seats won by each party. These mathematical ties suggest that, in theory at least, there is significant overlap between the various gerrymandering metrics.
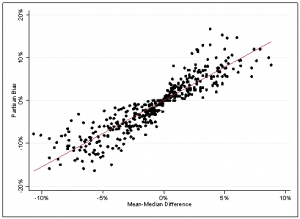
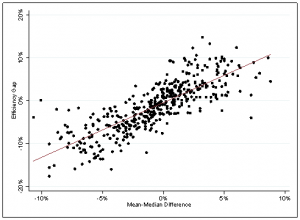
Next, Eric and I show that the overlap exists in practice as well. We calculate partisan bias, the efficiency gap, and the mean-median difference for state house plans from 1972 to 2014. We then plot these measures against one another in elections that were closer statewide than 55% to 45%. (The proponents of partisan bias and the mean-median difference discourage using these metrics when elections are uncompetitive statewide.)
As the below charts indicate, all three of the measures are strongly related. In each graph, the points hug the best fit line quite closely. The specific correlations are 0.89 (partisan bias and efficiency gap), 0.91 (partisan bias and mean-median difference), and 0.80 (efficiency gap and mean-median difference).

Lastly, to learn even more about the metrics’ connections, Eric and I subject them to factor analysis. (This is a data reduction technique that seeks to identify latent variables that are linear functions of the observed variables and that capture as much as possible of the variance in the data.) This analysis yields an exceptionally significant first factor that accounts for a whopping 97% of the total variance. All of the measures load very heavily onto this factor, and in the same direction.
The upshot of these findings is that, at least in competitive electoral settings, the academic debate over gerrymandering metrics is largely tangential. All of the measures are tightly interwoven in these settings, and tell mostly the same substantive story. Scholars, litigants, and courts may therefore cite as few or as many of the metrics as they like, secure in the knowledge that their choice is not particularly consequential.