Today, the MIT Election Data + Science Lab released the latest iteration of the Elections Performance Index (EPI). The index, which provides an objective measure of election performance in each state for federal elections, has now been updated to include data from 2022.
While the EPI tracks data as far back as 2008, it officially launched just over a decade ago in 2013. It has been updated throughout those ten years, including the addition of new indicators, but it remains a comprehensive, data-focused assessment of how election policy and administration function in all 50 states and DC. In a landscape where election officials must continually adapt to changing environments and new challenges, nonpartisan data-driven measures like the EPI are critical to identifying and sharing the story of how US elections are managed.
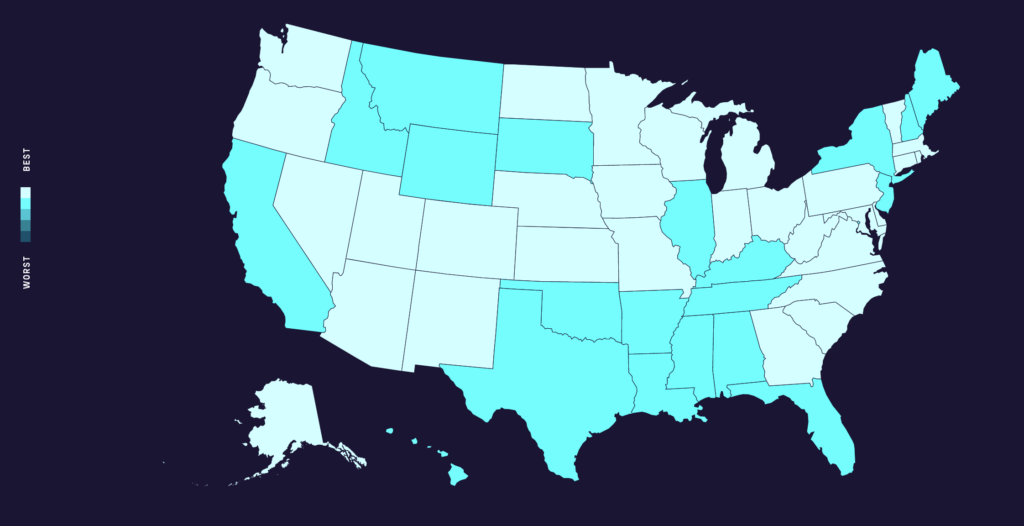
What does the 2022 Index show us?
The latest update to the EPI shows that election management across the United States improved in the 2022 midterm election, continuing an upward trend we see throughout the past few iterations of the index.
The EPI compares “like with like” elections, so we measure the 2022 election against previous midterms, rather than the most recent presidential election. But in many ways, the EPI shows us that the 2022 election was a return to “normal” after the challenges of 2020, and continued to consolidate the gains made in previous elections, including in 2020. Looking back at the 2018 midterm, we can see that one of the only indicators that fell between 2018 and 2022 was voter turnout. In 2018, however, turnout significantly outpaced the previous midterm; as a percentage of the voting-eligible population, the turnout in 2018 was the highest it has been in a century.
The country has improved on nearly every other indicator. Notably, the 2022 EPI also features new indicators—these indicators were added in 2020, and show up for the first time here for a midterm election. The inclusion of an indicator on risk-limiting audits, in particular, helped many states improve their scores.
Looking further back to the first midterm election the EPI measured, states’ massive improvements are even more dramatic. In 2010, the nationwide average score on the index was just 63%. In 2022, that has leapt to 80%, an incredible achievement. Among the biggest factors driving state improvement have been improved data collection and practices, as well as more capable websites that feature better tools for voters.
To explore those historical trends and see how states do over time and across borders, we encourage you to visit the EPI’s website at elections.mit.edu.
In summary: Election administration across the country continues to improve
The EPI provides an opportunity to step back from the immediate concerns of any given election and take a broader look at how elections are going overall. In this 2022 snapshot, we see that election policy and management in the United States continue to improve across the country. Following the 2020 election, which saw election officials working overtime to ensure that the primary and general elections were able to proceed safely and fairly in the face of the COVID-19 pandemic, the 2022 election saw both a return to “normal” and a consolidation of the improvements that were made. Compared with the most recent midterm election in 2018, the index shows us improvements across the board.
As we look forward to the 2024 EPI, we continue to consider ways to improve the index and to analyze the data we already have. Revisit the EPI webpage from time to time to see what we’re thinking about these issues and more.
The Elections Performance Index is a small part of a continuing conversation about election administration, based on data and nonpartisan commitment to improving how elections are run in the United States. Each election brings its own challenges, and we can’t say for certain what the EPI might tell us—or how it might change—in the years to come, but we can say with certainty that elections in 2022 were more transparent and easier to access when compared with 2010. We hope to see the trend continue.