This is a guest post by James Syme, a Fellow at the Pardee RAND Graduate School, and Daniel Wein, a cofounder of the Center for New Data, about an exciting new method for identifying communities of interest, with extensive potential applications in redistricting.
Communities of Interest (COIs) are vexing components of redistricting. They are broadly defined, fuzzy entities that are fundamental to representation, yet there is little empirical data about COI boundaries available for redistricters to leverage drawing districts. To help fill this gap, the Center for New Data is developing maps of COIs for each U.S. State. These COI maps are derived from a dataset of billions of anonymous cellular device geolocation pings CND has acquired through partnerships with private vendors, which represent approximately 10% of the U.S. population during any given month (approximately 35 million unique devices). These maps are intended to provide redistricters, community advocates, and the public at large systematic evidence about the boundaries of COIs, especially as many communities are often unable to participate in the redistricting process. We expect that they may be especially useful for evaluating how districting plans cut and/or preserve COIs en masse.
To facilitate the dissemination of the COI maps, the Center for New Data has partnered with Dave’s Redistricting (DRA) to provide public access to these maps using their Custom Overlays feature. Dave’s Redistricting users can leverage existing functionality to analyze how Congressional and other legislative districts split these COIs using the Effective Split Index and Uncertainty Bits (see Wang et al. 2021). At the time of this writing, maps of COIs from 9 states for the month of April 2021 are available on DRA: CA, FL, MO, NC, NY, OH, UT, TX, and WI, and we are continuing to add states. For each state, COI maps are available for at four levels, each of which is associated with a different parameterization of the community detection algorithm used to generate them: Medium-Small, Medium, Medium-Large, and Large. To access COI maps for these states on DRA, use the custom overlay feature to add a map, then filter by plantype (coi), name (CFND), and the state. Deeper dives into the COIs themselves, including diagnostics related to the method, can be performed using the Center for New Data’s internal tool.
The Method
So how are these maps generated? The Sesame Street song People in Your Neighborhood is perhaps a useful starting point. The song asks “Who are the people in your neighborhood?”, ultimately providing the answer: “They’re the people that you meet, when you’re walking down the street, they’re the people that you meet each day.” Sesame Street may not be the inspiration for our approach to identifying COIs (sorry, Big Bird), but it proves an effective illustration of the conceptual approach.
Using geospatial mobility data, we approximate how people who live close to each other interact throughout the day and leverage community detection algorithms to cluster groups of people together. This approach is based on the method explored in greater detail in an article manuscript by James Syme and Benjamin Nyblade (Syme and Nyblade, ms.).
COIs follow some general structural constraints. Although there is no singular definition of COIs, the California Constitution offers a prototypical definition to guide the method: “A community of interest is a contiguous population which shares common social and economic interests that should be included within a single district for purposes of its effective and fair representation. (California Constitution, Article XXI, Section 2(d)(4))” Three key simplifying assumptions build upon this definition to facilitate the identification of COIs:
- Contiguity: COIs are geospatially contiguous.
- Proximity as Interest: At least some sociopolitical and economic interest(s) can be approximated by geospatial proximity.
- Community Uniqueness: At each COI level, every resident lives within only one COI.
The process for identifying COIs can then be summarized in 5 steps.
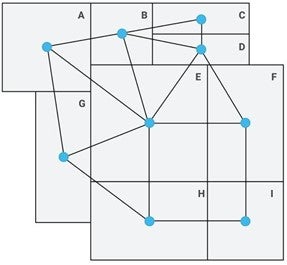
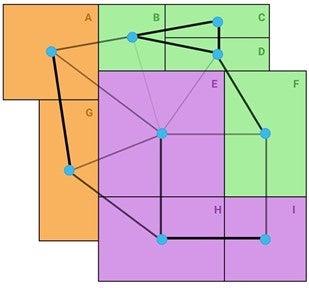
- Partition the State into Component Polygons. We use Census block groups (CBGs) as the partition of each state. The block groups induce a graph on the state, where each block group is a vertex. Edges are formed between two vertices when their associated CBGs share a border.
- Assign Devices to a Block Group. Device pings show where a device moves throughout the day, and device dwellings can be inferred from clustering. Each device’s home Census block group can then be estimated based on the dwelling where the device spends most of its time. Each block group then has some number of devices associated with it (although some block groups have no population, which we exclude).
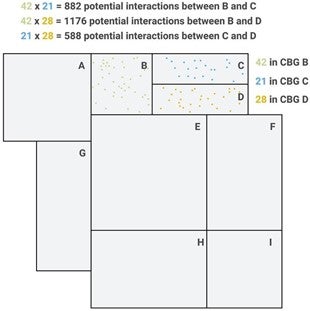
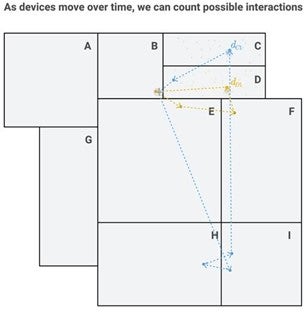
- Count Device Pairings Between Devices from Adjacent Block Groups. Devices from adjacent block groups interact if they are in the same place at the same time. A device pairing occurs if two devices interact at any point during some time period (we use a month). Using the mobility data, we can count device pairings. The potential number of observable device pairings between two adjacent block groups is the product of the number of devices associated with those block groups.
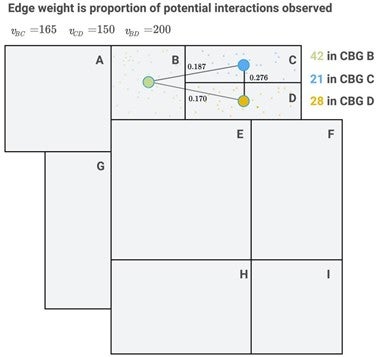
- Set Edge Weights on The Graph. Edge weights are numerical values associated with edges on the graph. The weights represent the strength of connection between the vertices that the edge connects. For each pair of adjacent block groups, we set the weight as the fraction of potential device pairing that were observed.
- Apply Community Detection Algorithms. Community detection algorithms are then applied to the graphs to identify COIs. We use the Leiden (Traag et al. 2019) algorithm, which guarantees connected communities and maximizes the Constant Potts Model. We apply this at multiple levels (corresponding with different values of the Leiden algorithm resolution parameter) including Medium-Small (0.01), Medium (0.001), Medium-Large (0.0001), and Large (0.00001).
The resulting maps produce contiguous communities across the state for each of the four levels of refinement. There are occasionally areas for which no devices are available; this generally occurs in block groups with little or no population. This occurs in both urban and rural areas. This method infers Communities of Interest solely from collocation of people in neighboring census block groups–it does not identify groups based on pre-identified socio-political or demographic characteristics. Communities identified through this method are solely based on people spending time in the same places.
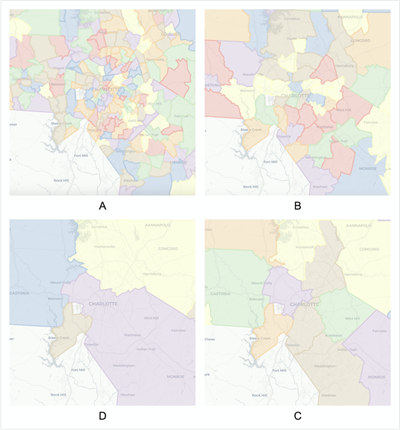
Example COI boundaries near Charlotte, NC at four levels. Clockwise from top-left: (A) Medium-Small, (B) Medium, (C) Medium-Large, (D) Large.
Validation of these COIs is ongoing. Initial validation has focused on comparing COIs generated via the method against public COI submissions and other known boundaries. For example, the California Citizen Redistricting Commission accepted public feedback on parts of Los Angeles County in August 2020. That feedback included several proposed maps of Boyle Heights, a primarily Hispanic/Latino community east of downtown Los Angeles. All seven of the Boyle Heights maps submitted are fairly similar (although the specific boundaries vary), as can be expected. Two of the seven maps that were submitted are shown below in comparison to the boundaries of the comparable COI identified through this method (Medium-Large COI 213, left).
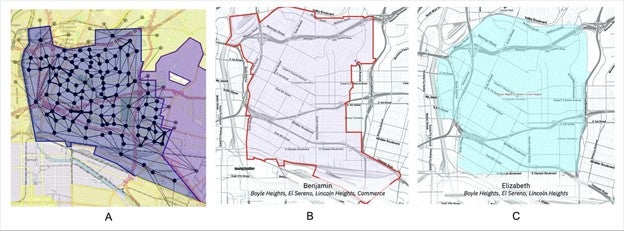
Generated COI centered near Boyle Heights (dark blue with nodes, A) compared with two of seven relevant submissions to the CCRC (B, C).
The Center for New Data is undertaking additional validation exercises. First, a similar validation step is beginning with states like Wisconsin to compare COIs found on Representable to those generated in this method. Second, temporal stability of communities is being evaluated. Current maps were developed using device pings from April 2021. COIs identified using additional months of data are forthcoming and may show some differences in COIs. We are undertaking preliminary quantifications of those changes. Aggregate communities that incorporate multiple months of data will follow. Finally, sample analytics are being undertaken to determine demographic representativeness of communities and devices.
Our hope is that these maps that leverage a new approach and source of data for understanding COIs will be of use to a wide range of stakeholders, policymakers and scholars involved in redistricting. These maps represent one dimension of COIs, and are not meant to supplant self-identification or other approaches identifying COIs. For both policymakers and scholars, we think the systematic nature of this approach to COI identification may be valuable in assessing how certain voices and communities—communities that might not be represented or have a voice in the redistricting process—may be affected by district boundaries. For community groups and advocates, we believe that our maps can help provide additional systematic evidence that groups can point to as they seek to represent their communities.
If you’d like to schedule a demo of this tool to learn how it might serve redistricting use cases in your community, or simply want to receive regular updates on the project, visit the Center for New Data’s redistricting hub at newdata.org/redistricting.