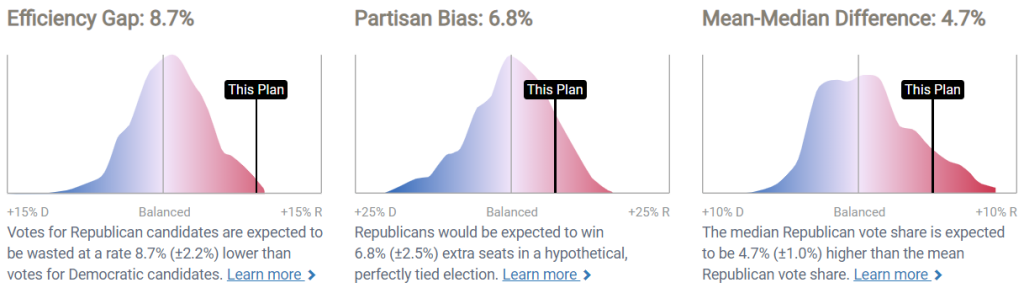
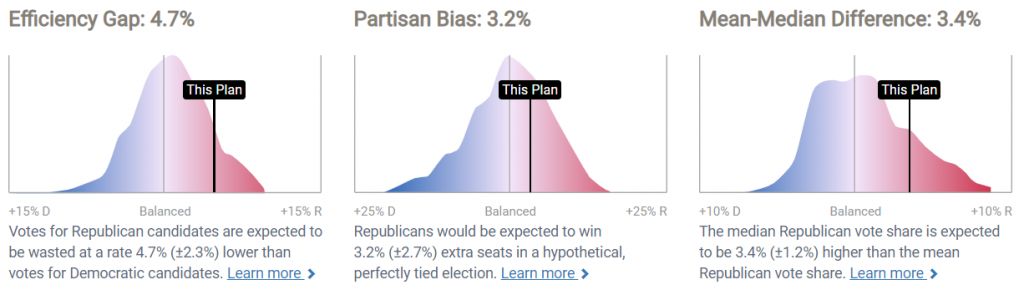
Earlier today, the North Carolina legislature approved remedial maps to replace the state house and state senate plans that were recently struck down as partisan gerrymanders. PlanScore assessed the remedial maps, and here are the results. For the state house, the old plan had an efficiency gap of 9%, a partisan bias of 7%, and a mean-median difference of 5% (all in a Republican direction, and based on a model using 2016/2018 data). On the other hand, the new map has an efficiency gap of 5%, a partisan bias of 3%, and a mean-median difference of 3% (again all pro-Republican). So the new map is about half as skewed as the old plan.
Old House Plan:
New House Plan:
For the state senate, the old plan had an efficiency gap of 11%, a partisan bias of 6%, and a mean-median difference of 4% (all pro-Republican). By comparison, the new map has an efficiency gap of 3%, a partisan bias of 2%, and a mean-median difference of 3% (all pro-Republican). So the new map is approximately one-third as skewed as the old plan.
It’s also interesting to compare the remedial plans to the distributions of maps randomly generated by the plaintiffs’ expert, Jowei Chen. (Especially since each remedial plan used one of Chen’s maps as its starting point.) At the state house level, Chen’s maps contained anywhere from 43 to 51 Democratic districts with a median of 46 (assuming a 48% Democratic statewide vote share). The remedial plan has 49 Democratic districts in that electoral environment. At the state senate level, Chen’s maps contained anywhere from 19 to 22 Democratic districts with a median of 20. The remedial plan has 22 Democratic districts.
I should note that this isn’t a perfect apples-to-apples comparison. Chen analyzed partisanship using an aggregate of ten statewide elections from 2010 to 2016. PlanScore relies on a model using 2016/2018 data in which legislative vote share is a function of presidential vote share and incumbency. Still, PlanScore assumes about the same electoral environment as Chen (48% Democratic) so the estimates for the remedial plans are at least roughly comparable to Chen’s figures.
Another caveat is that, because of North Carolina’s whole county provision, its maps aren’t drawn in one statewide swoop. Rather, districts are drawn within a large number of county groupings. It’s thus perfectly possible for certain county groupings to be outside the distributions of simulations for those groupings, even if the maps as a whole are within the statewide distributions.
That said, one’s conclusion about the remedial plans plainly depends on the baseline. Given a baseline of perfect symmetry, one would find the remedial plans better than their predecessors but still reasonably far from treating both parties equally (especially the House plan). But given a baseline of randomly generated maps, one would find the remedial plans satisfactory. Both plans fall within the corresponding distributions of simulated maps—and indeed on the Democratic side of the distributions’ medians.