The following is a guest post from Jon Eguia:
In a previous post I introduced a measure of partisan advantage in redistricting. This measure compares the election outcome to a benchmark seat distribution that is not directly influenced by redistricting. More precisely, a party’s artificial partisan advantage is the difference between the number of seats obtained by the party, and the number of seats proportional to the share of the population in counties won by the party.
I suggested that a map be presumed to be a partisan gerrymander if its artificial partisan advantage is greater than 0.5 seats plus 10% of the size of the state’s delegation.
Using election data from 2012 to 2018, I show that according to this rule, North Carolina’s congressional redistricting map must be presumed to be a partisan gerrymander.
North Carolina has 13 seats in the House of Representatives. The following table shows, for the Republican party, and for each US House of Representatives election in North Carolina:
[1] the party’s share of the two-party vote in the state;
[2] the number of counties in which the party won the popular vote;
[3] the share of the state’s population in these counties;
[4] the county-based seat benchmark for the Republican party, computed as 13 * [3];
[5] the number of seats the Republican party won according to the election results; and
[6] the artificial partisan advantage for the Republican party, in seats, computed as [5] – [4].
| Republican Party \ Election | 2012 | 2014 | 2016 | 2018 |
| [1] Vote-share | 49.1% | 55.8% | 53.3% | 51.0% |
| [2] Counties won | 57 | 74 | 74 | 72 |
| [3] Population in [2] | 44.6% | 62.4% | 53.7% | 51.1% |
| [4] Benchmark = [2]*13 | 5.80 | 8.02 | 6.98 | 6.64 |
| [5] Seats won | 9 | 10 | 10 | 10 |
| [6] Artificial partisan advantage, in seats [5]-[4] | 3.20 seats | 1.98 seats | 3.02 seats | 3.36 seats |
The first two rows are only for illustration, not used in the computation of the county-based seat benchmark, which only counts the population of counties in which a party wins the popular vote.
In the 2012 election to the US House of Representatives in North Carolina, the Republican party won the popular vote in counties with a total population of 4,253,000 inhabitants, which is 44.6% of the state’s population. The county-based seat benchmark is thus 44.6% of North Carolina’s delegation to the House of Representatives, namely, 44.6% * 13 = 5.80 seats. Since the party won 9 seats, its artificial partisan advantage in this election was 9 – 5.80 = 3.20 seats.
In 2014 the Republican party won the popular vote in seventeen additional counties, so its seat benchmark increased, and the party picked up one seat, to obtain a 10-3 majority. In 2016, the Republican vote share ebbed, and while the popular vote flipped from a Democratic majority to a Republican one in three small counties, it flipped from a Republican to a Democratic majority in three larger ones, for a net substantial decrease in the share of total population in counties won by Republicans, and thus in the party’s seat benchmark. Nevertheless, the party kept its 10 seats.
In the 2018 election, the Republican party vote share decreased further, and the popular vote in two additional counties (New Hannover and Richmond, with a combined population of over 249,000 inhabitants) flipped to the Democratic Party, so the share of the population in counties won by the Republican Party decreased to 51.1%, corresponding to 6.64 seats. Nevertheless, according to election day results, the Republican Party yet again won 10 seats, so the artificial partisan advantage increased once more to 10 – 6.64 = 3.36 seats.[1]
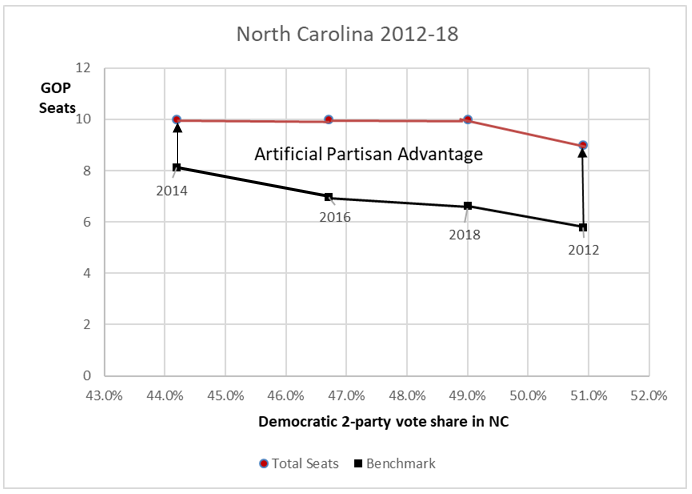
Averaging across all four congressional elections from 2012 to 2018, the artificial partisan advantage for the Republican party in North Carolina was 2.87 seats. Discounting a rounding margin of 0.5 seats, the remainder 2.37 seats is over 18% of the size of the state delegation, above the suggested 10% threshold. Hence the redistricting map, according to this measure, falls under the presumption of being a partisan gerrymander in favor of the GOP.[2]
The following figure illustrates these results. The evolution from 2014 to 2018 reflects the essence of a successful partisan gerrymander: as the Republican party’s electoral fortunes worsen, counties fall to the Democratic party… but gerrymandered districts do not. The resulting gap is the artificial partisan advantage.
This result corroborates what was found according to other measures, such as partisan bias or the efficiency gap. Still, this result provides a novel piece of evidence: it shows an artificial partisan advantage intrinsic to this redistricting map, net of any advantage due to sorting. The evidence of an artificial advantage cannot be explained, at all, by the geographic sorting of the population of voters. Supreme Court hearings on the consolidated cases Rucho v Common Cause and Rucho v League of Women Voters about North Carolina’s congressional redistricting map are scheduled for March 26th, 2019. The evidence on the artificial partisan advantage supports the case to uphold the District Court ruling that struck down North Carolina’s redistricting map as a partisan gerrymander.
[1] Under allegations of fraud, results in district NC-9 were later not certified.
[2] In fact, in a working paper I compute the artificial partisan advantage for all 43 states that draw congressional redistricting maps, and I find that North Carolina’s map is the worst partisan gerrymander in the nation.